
At Kunnect, we love infographics. We’ve compiled some of the best call center infographics from the past couple years to fill you in on the state of call centers today and where they’re going in the future. You might be surprised by some of these numbers – we know we were.
There’s so much going on here, but perhaps the most interesting point is that the human touch is always going to be important in contact centers. Technology is changing the way call centers operate, but it won’t change everything.
Other interesting takeaways:
- Video chat is coming to the contact center. Imagine if the customer could show the agent the problem with the cable box.
- The customer is boss, and that trend shows no signs of slowing. Customers want personalized service – and they want it across all channels. Contact centers have to deliver the information when and where the customers want it.
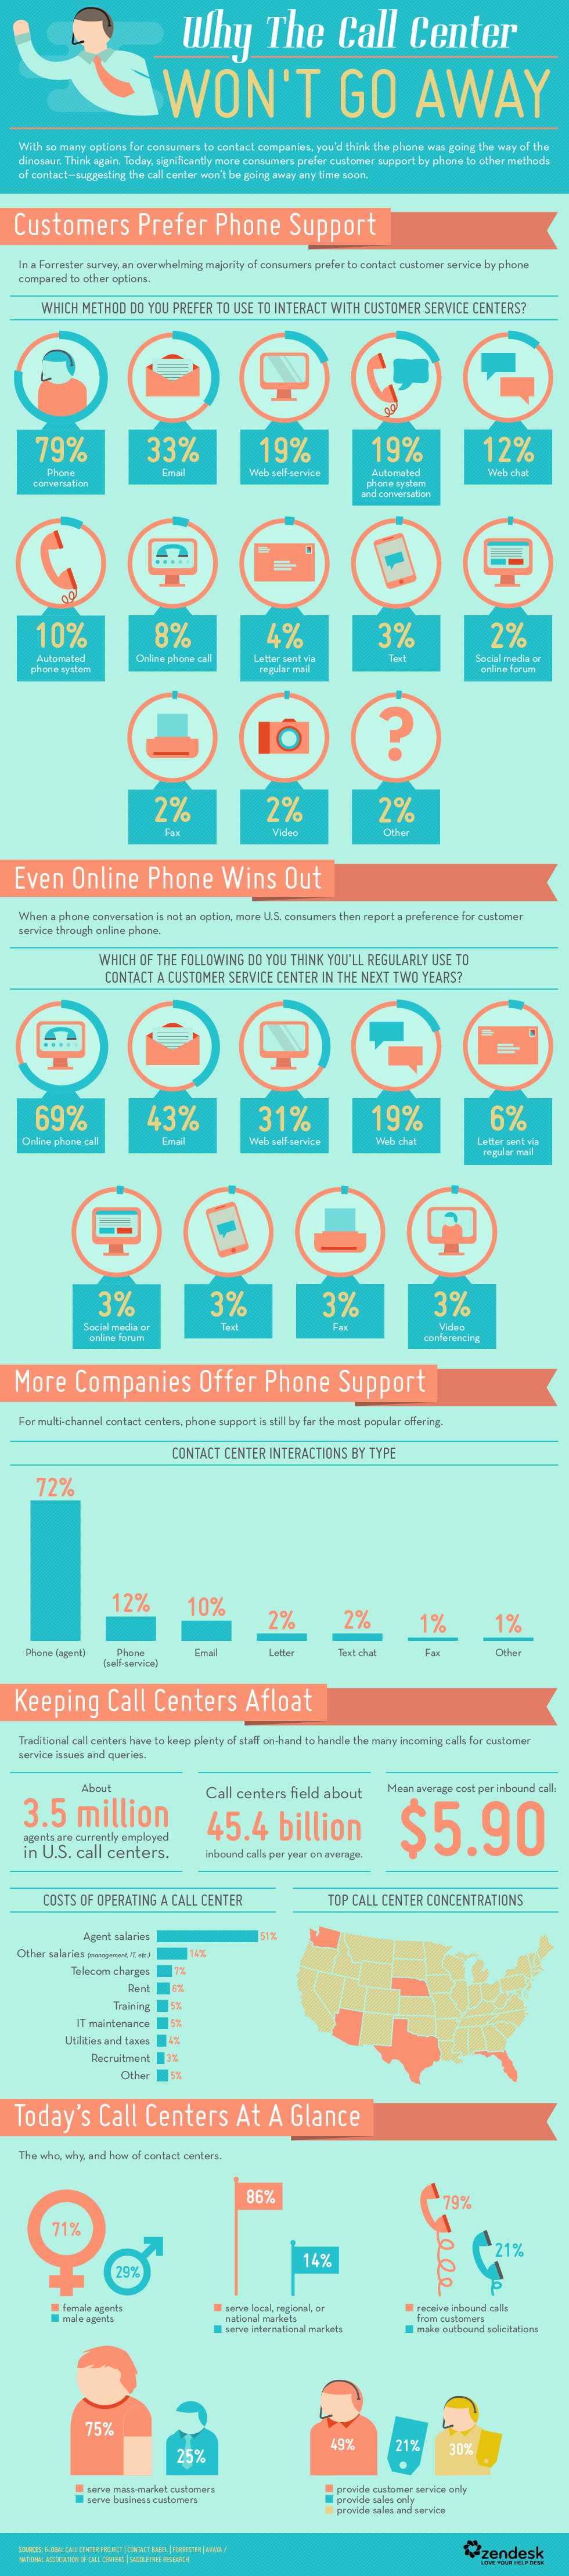
There are a million and one ways for a customer to reach a company these days – email, chat, text, social media, web self-service and more. But how do they want to reach us? Yes, some 80 percent still prefer to pick up the phone.
This data is a couple years old, but the stats haven’t changed. Contact centers need to make all channels available, as we saw in the graphic above, but the old telephone doesn’t appear to be going anywhere fast.
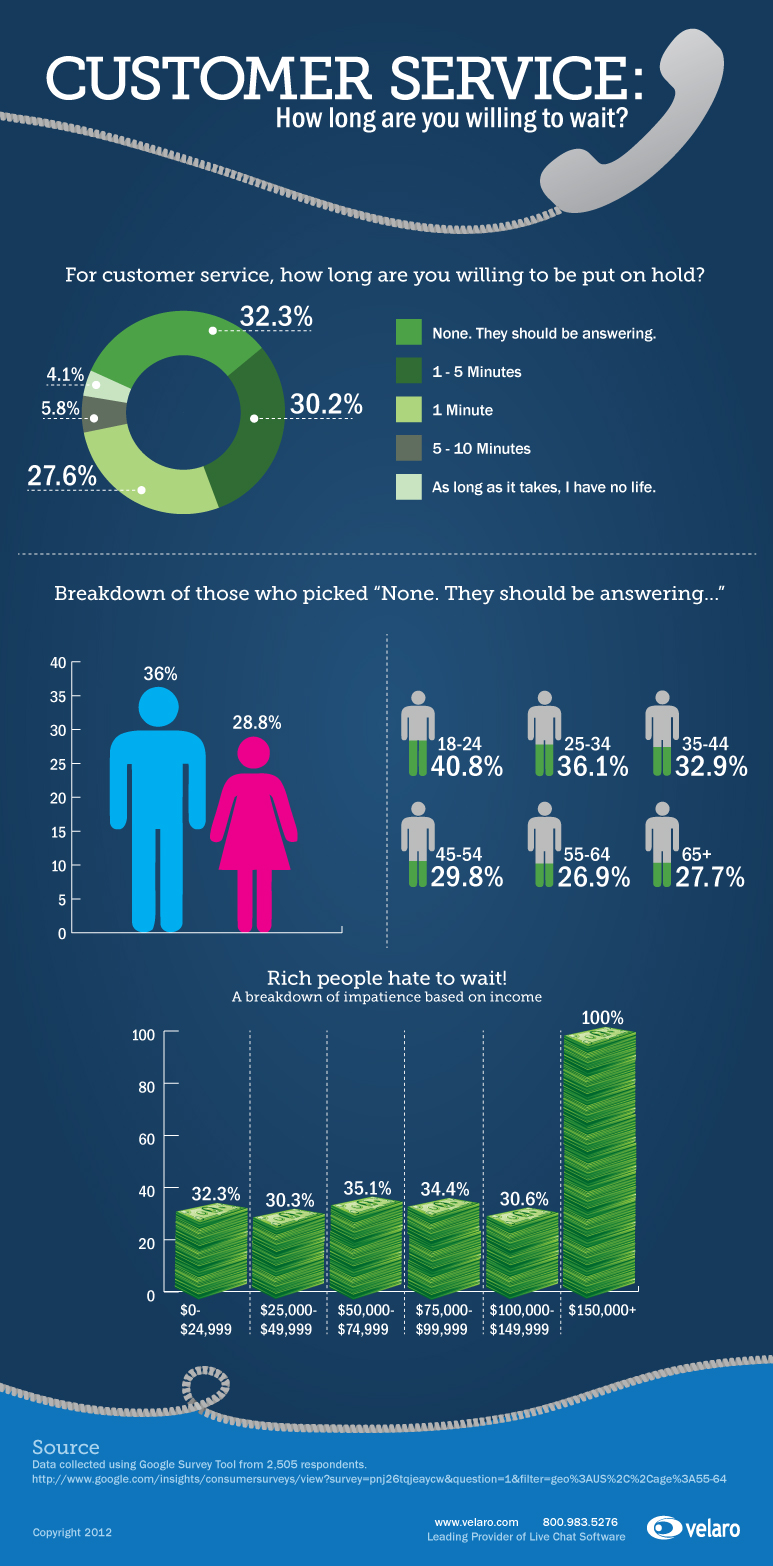
This is a fascinating look at a customer’s view on wait times. Nearly one-third of people say they shouldn’t have to wait at all. What’s really interesting: the income breakdown. Every person surveyed with an income of more than $150,000 per year said they shouldn’t have to wait all. For those making less than $150,000, only about one-third of people answered the same way.
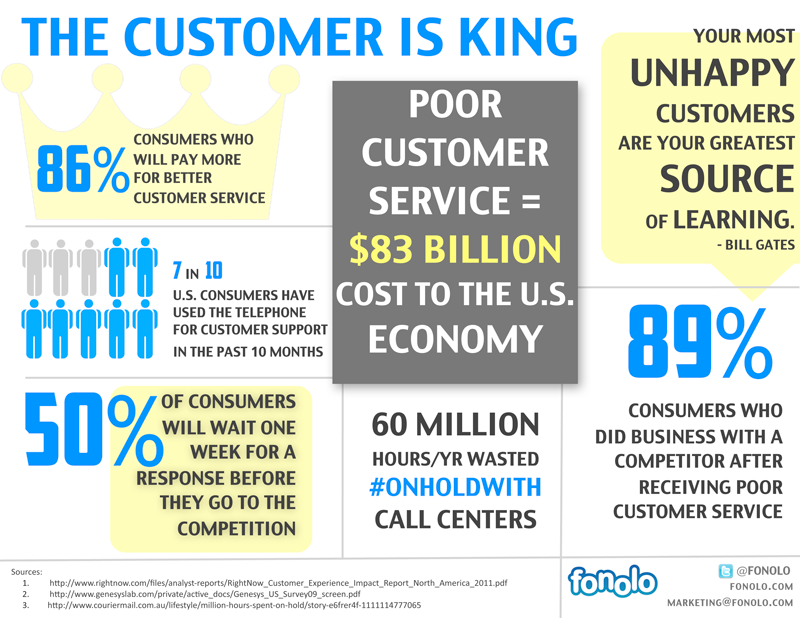
Customers aren’t afraid to ditch you for the competitor if they’re unsatisfied with your customer service. In fact, nearly 90 percent have done so. However, they are willing to give a fair amount of time to respond. Half of people will allow a whole week before they stop doing business with the company, which we think is pretty surprising. That’s a long time in today’s world.
Note: Check out the stat on the number of hours wasted per year on hold with call centers. Whoa. Imagine what people could have done with all that time.
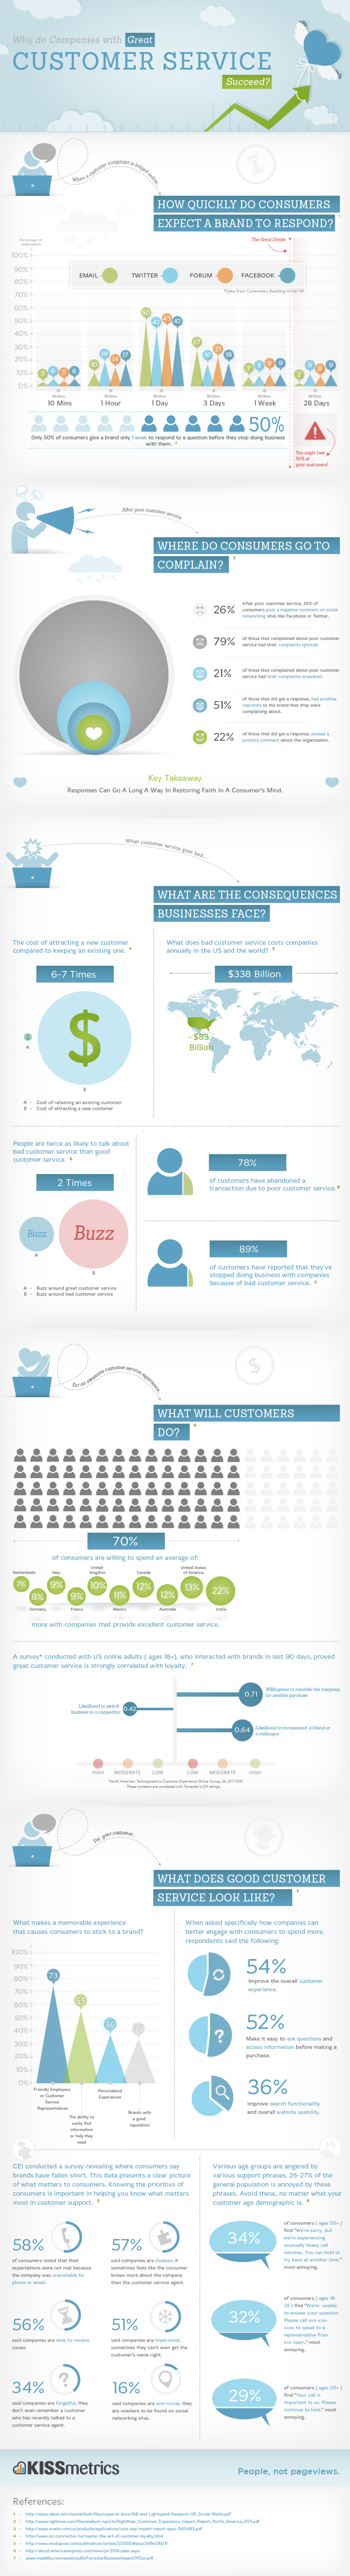
This one offers a ton of interesting data about customer expectations and the cost of letting them down. Did you know that the cost of attracting a new customer is six to seven times higher than the cost of keeping an existing one? We can’t think of a better stat to illustrate the importance of good customer service.
Other interesting takeaways:
- Bad customer service costs companies across the world $388 billion each year.
- More than a quarter of customers take to social media to complain about a bad customer service experience. Nearly 80 percent of them get ignored.
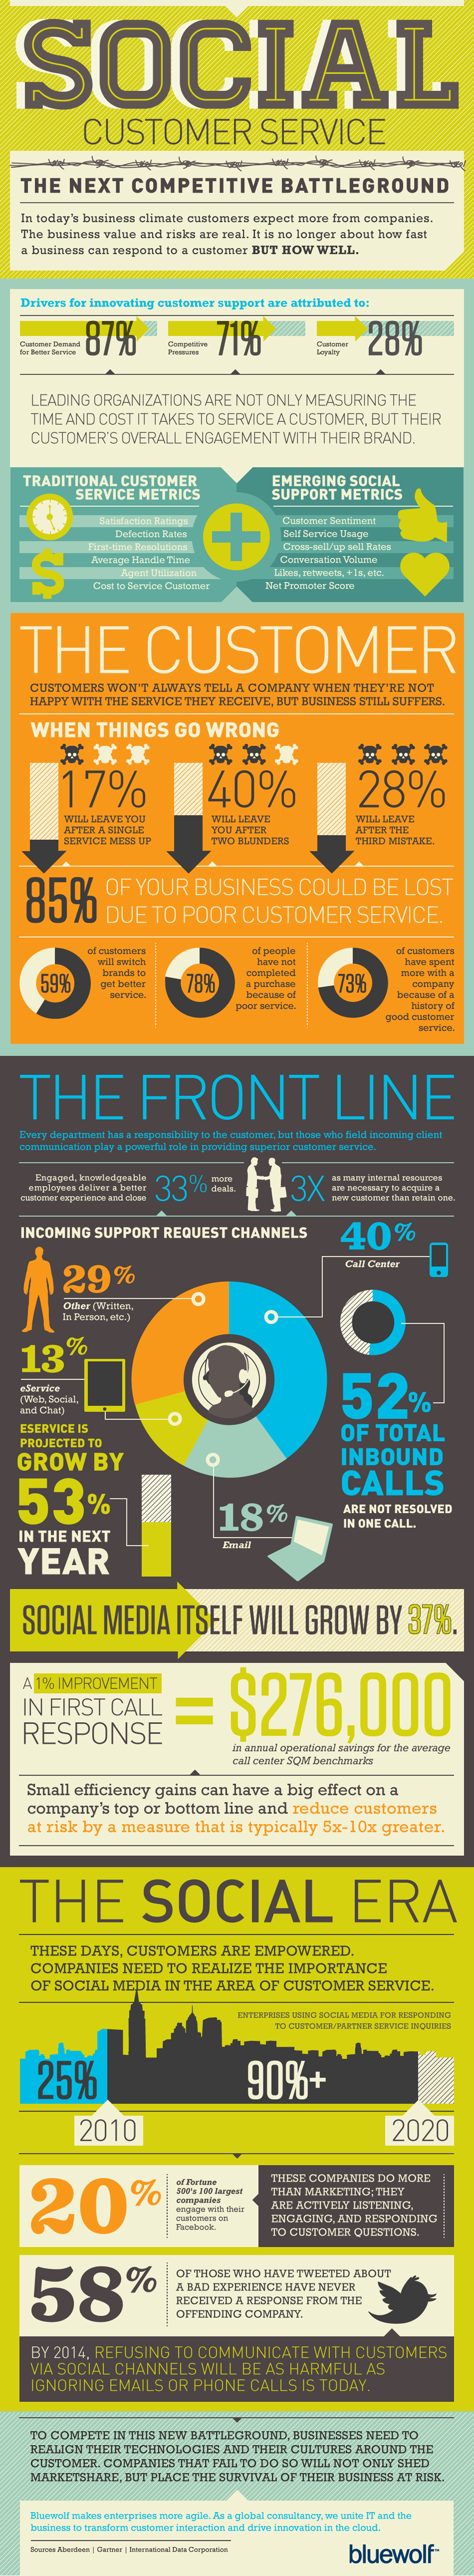
This graphic further illustrates how far we have to go when it comes to social media customer service. Only 20 percent of the big guys – Fortune 500 companies – are engaging with customers on Facebook.
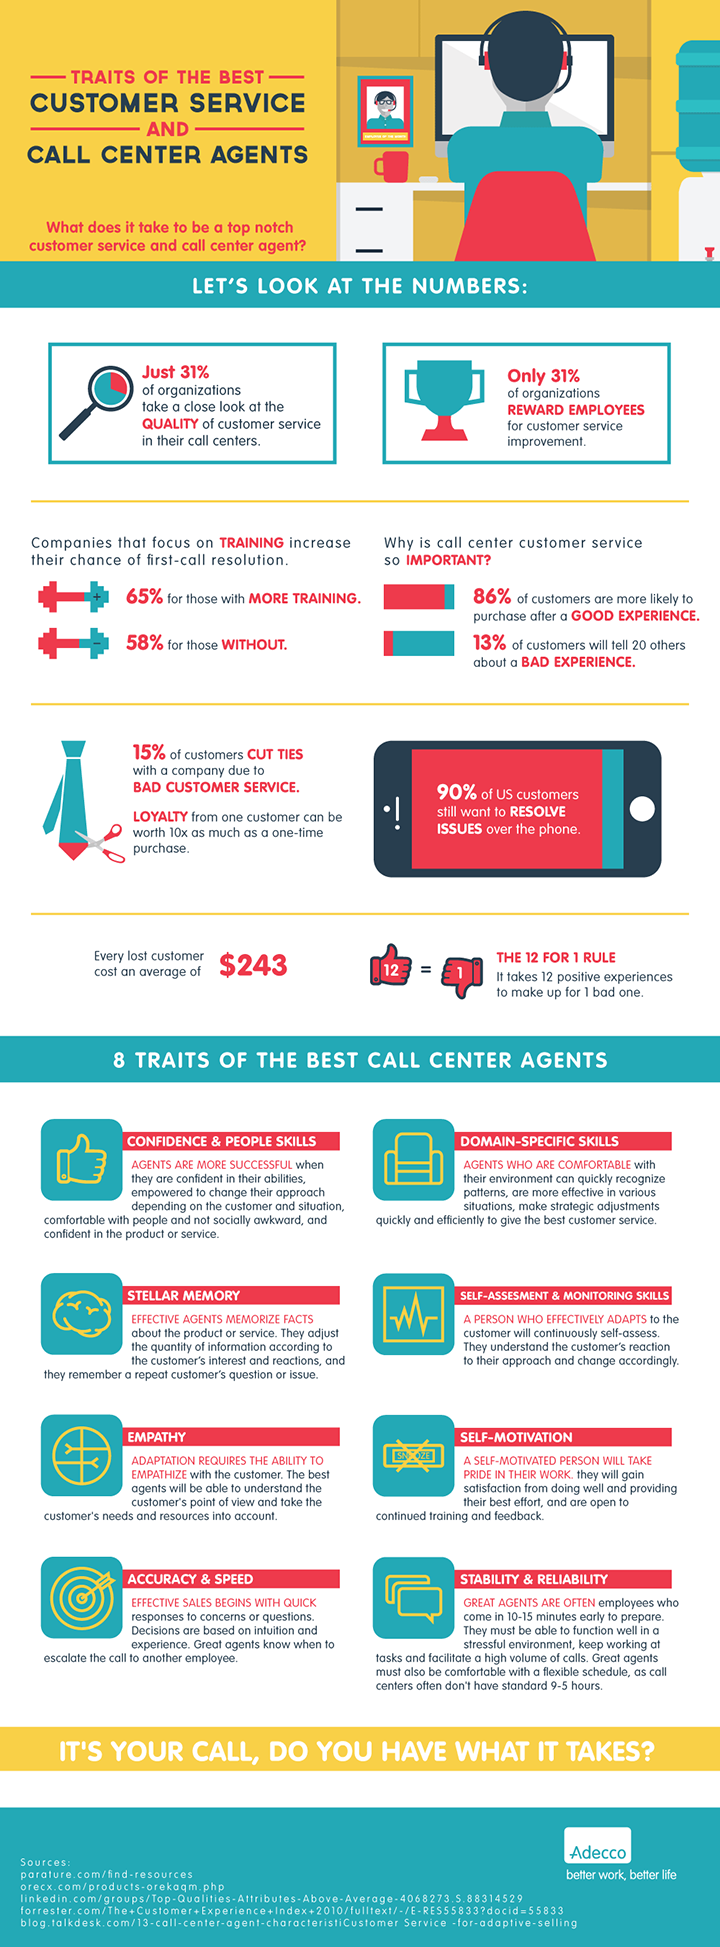
High-quality agents are crucial to the success of our brands, but only 31 percent of companies are taking a close look at quality in call centers. Also, we all know that rewards are powerful incentives, but only 31 percent of companies are rewarding their call center employees for measured improvement. What gives?